2008 - 2012 Flavor & Fragrance Industry
Leaders
2008 - 2012 Estimated Sales Volume in
Millions
(Revised Final Estimates as of February 26,
2014)
|
..
|
Company
|
2008
|
2008
|
Est. 2008
|
2009
|
2009
|
Est. 2009
|
2010
|
2010
|
Est. 2010
|
2011
|
2011
|
Est. 2011
|
2012
|
2012
|
Est.
2012
|
..
|
|
Rank
|
..
|
Country
Currency
|
=US $
|
Market Share1
|
Country
Currency
|
=US $
|
Market Share1
|
Country
Currency
|
=US $
|
Market Share1
|
Country
Currency
|
=US $
|
Market Share1
|
Country
Currency
|
=US $
|
Market Share1
|
Source
|
|
1
|
Givaudan
|
4,087 CHF
|
$3,828.7
|
18.9%
|
3,959 CHF
|
$3824.0
|
19.1%
|
4,239 CHF
|
$4538.4
|
20.6%
|
3,915 CHF
|
$4171.3
|
19.1%
|
4,257 CHF
|
$4649.2
|
20.3%
|
Givaudan
|
|
2(3)
|
Firmenich
|
2,641 CHF
|
$2474.1
|
12.2%
|
2,873 CHF
|
$2775.0
|
13.9%
|
2,781.6 CHF
|
$2978.0
|
13.5%
|
2,636.00 CHF
|
$2,808.6
|
12.9%
|
2,890 CHF
|
$3156.2
|
13.8%
|
Firmenich
|
|
3
|
IFF
|
$2,389
|
$2,389
|
11.8%
|
$2326.2
|
$2326.2
|
11.6%
|
$2622.9
|
$2622.9
|
11.9%
|
$2,788.0
|
$2,788.0
|
12.8%
|
$2821.4
|
$2821.4
|
12.3%
|
IFF
|
|
4
|
Symrise
|
1,319.9 €
|
$1837.4
|
9.1%
|
1362.0 €
|
$1952.5
|
9.8%
|
1571.9 €
|
$2106.6
|
9.6%
|
1583.6 €
|
$2052.2
|
9.4%
|
1734.9 €
|
$2287.4
|
10.0%
|
Symrise
|
|
5(4)
|
Takasago
|
¥123,973
|
$1365.6
|
6.7%
|
¥114,347
|
$1228.5
|
6.1%
|
¥114,861
|
$1416.2
|
6.4%
|
¥113,676
|
$1474.1
|
6.8%
|
¥118,973
|
$1374.1
|
6.0%
|
Takasago
|
|
6
|
Wild Flavors
|
NA
|
NA
|
NA
|
NA
|
NA
|
NA
|
NA
|
NA
|
NA
|
650 €
|
$842.3
|
3.9%
|
838 €
|
$1104.9
|
4.8%
|
Wild
Flavors
|
|
7
|
Mane SA
|
332.5 €
|
$462.9
|
2.3%
|
376.2 €
|
$539.3
|
2.7%
|
480.1 €
|
$643.4
|
2.9%
|
530.1 €
|
$687.0
|
3.2%
|
638.4 €
|
$841.7
|
3.7%
|
Mane
SA
|
|
8 (6,7)
|
Sensient Flavors
|
~$591**
|
~$591**
|
2.9%
|
~$548.7**
|
~$548.7**
|
2.7%
|
~$582.6**
|
~$582.6**
|
~2.6%
|
~$619.7**
|
~$619.7**
|
~2.8%
|
~$621.5**
|
~$621.5**
|
~2.7%
|
Sensient
Technologies
|
|
9
|
Frutarom
|
$473.3
|
$473.3
|
2.3%
|
$425.2
|
$425.2
|
2.1%
|
$451.1
|
$451.1
|
2.1%
|
$518.4
|
$518.4
|
2.4%
|
$618
|
$618
|
2.7%
|
Frutarom
|
|
10
|
Robertet SA
|
303.17 €
|
$422.0
|
2.1%
|
305.1 €
|
$437.4
|
2.2%
|
362.25 €
|
$484.5
|
2.2%
|
373.28 €
|
$483.7
|
2.2%
|
395.6 €
|
$521.6
|
2.3%
|
Robertet
|
|
11 (5)
|
T. Hasegawa
|
¥45,421
|
$500.3
|
2.5%
|
¥43,244
|
$464.6
|
2.3%
|
¥45,167
|
$556.9
|
2.5%
|
¥44,246
|
$573.8
|
2.6%
|
¥44,386
|
$512.6
|
2.2%
|
T.Hasegawa
|
|
...
|
Top 11 Totals
|
...
|
$14344.2
|
70.7%
|
...
|
~$14521.4
|
72.6%
|
...
|
$16381.6
|
74.5%
|
|
$17161.1
|
78.7%
|
|
$18508.6
|
80.8%
|
..
|
|
|
All Others
|
...
|
$5955.8
|
29.3%
|
...
|
~$5478.6
|
27.4%
|
...
|
$5618.4
|
25.5%
|
|
$4638.9
|
21.3%
|
|
$4391.4
|
19.2%
|
..
|
|
|
Total Market
|
...
|
$20,300
|
..
|
...
|
$20,000
|
...
|
...
|
$22,000
|
...
|
|
$21,800
|
|
|
$22,900
|
|
..
|
For 2012, based on comparison of major currency rates (on Dec.
31), the CHF/USD (Swiss Franc vs. US$) had an increase of 2.5%, and
the EUR/USD (Euro vs. US$) gained 1.7%. The GPB/USD (British pound
vs. US$) increased 4.7% and the Brazilian Real (BRL/USD) declined
9.1%. The JPY/USD (Japanese Yen vs. US$) had a decrease of 10.9% and
the CNY/USD (Chinese Yuan v. US$) increased of 1% while the INR/USD
(Indian Rupee v. US$) decreased 3.3%. However, comparing single
points in time can be somewhat misleading as during the year major
currency swings occurred, particulary in the EU countries due to the
continuing economic instability. For a number of major companies
(e.g., Mane, Firmenich, Givaudan, Symrise, Frutarom) 2012 was
remarkably successful with some of the largest year-to-year gains in
recent years. Overall we estimate that the total market grew about
5%+ in US $ from 2011.
With the acquisition by Wild Flavors of certain assets of A. M.
Todd's operations in November 2011, and Wild
Flavors disclosure of sales for the first time, this now
places them in our rankings.
It should be noted that with the acquisition by Kerry of
Cargill Flavor systems in December of 2011 that Kerry Ingrededients
& Flavors possibly should be in the Top Ten. It should also be
noted that in Frutarom's
Q2 & Half year 2012 press release, they estimated that
Frutarom is the No. 7 company and Kerry was the No. 8
company.
Sales results for 1999 to 2002 are available HERE
and for 2002 to 2006 click HERE. This
tables include Quest International in the Top 10 for years 1999-2006.
For 2007 to 2011 click HERE.
(3) Accounting Period of July 1 to June
30
(4) Accounting Period of April
1 to March 31
(5)Accounting Period of Oct. 1
to Sept, 30; Net sales given are Company consolidated sales, See
T.Hasegawa
Co., Ltd.
(6) Accounting Period of Sept.
1 to August 31 until year 2000. In year 2000, Universal Foods changed
is name to SENSIENT TECHNOLOGIES CORPORATION and the Flavor division
is now known as Sensient Flavors. In addition, the accounting period
was changed to January 1 - December 31 starting in year 2000 and in
the "funny" way of making one look larger than they really are in
F&F, Sensient's Flavor sales from 2000-2011 included "Dehydrated
Products" (onion/garlic/chilies/dehydrated vegetables) which are
not flavors or fragrances in the conventional sense. In our
figures for Sensient, we have removed sales for the "Dehydrated
Products" for 2000-2011.
Note - for companies with
accounting periods that overlap calendar years, sales are stated for
the year in which the majority of sales periods occur. For example,
if Takasago's year end is March 31, 2002 we treat that as year 2001
sales. Similarly, if Firmenich's year end is June 30, 2002 we report
the year ending as 2001 sales. While not exact, we feel that this
treatment still provides an accurate overall basis for comparison.
Similarly, as noted, currency calculations are based on calendar year
end rates for comparison consistency. If fiscal year end rates were
employed the U.S. $ figures would be somewhat different, but totally
confuse comparisons.
Note - Top Ten Total for market share does
not neccessarily add due to rounding for individual
companies.
Note - all foreign currency
calculations for the table are based on December
31 rates for the year
indicated
(7) ** See also Note (6).
F&F figures in the tables for 2000-2011 for Sensient Flavors
are estimates as we
have removed reported sales of "Dehydrated products" . In 2006,
dehydrated products were 27% of the reported F&F sales, in 2007
& 2008 also about 27% of sales. In 2009 & 2010 we estimate
that dehydrated products were about 29% and 28% of sales,
respectively. In 2011, 28% of F&F sales were dehydrated products.
In 2012, 29% of F&F sales were dehydrated
products.
In the 2012 10-K report Sensient began
reporting F&F sales for the Asia Pacific, China and Flavors
Central & South America areas that previously appeared in
Corporate & Other. SPECIAL NOTE - However, for 2012, they
also include "intersegment" sales. They also included new figures
for 2010 & 2011 which are not reffected in our past years
figures.
----------------------------------------------------------------------------------------------------
Firmenich
2012-2013 Sales
- Oct. 10, 2013 - For the financial year ended
June 30, 2013, Firmenich posted sales of CHF 2,890 million, an
increase of 9.6%. Perfumery posted single-digit sales growth in local
currencies. Flavors recorded high single-digit sales growth while
Ingredients sales were down slightly in fiscal year 2013.
Frutarom
Full Year 2012 Sales
- Haifa, Israel – March 13, 2013 -
Frutarom's revenues in FY 2012 totaled US$ 618 million, a 19.2%
increase over 2011. Net profit increased 24% to US$ 52
million.
Symrise
Full Year 2012 Sales - Holzminden, Germany
- March 12, 2013 - In 2012 Symrise reported sales of
€1,734.9 million
(+9.6%) or +6 % in local currencies, while Net Income increased 7.5%
to €157.5 million.
Scent & Care reported sales of €883
million (+10%) or +7.0% in local currencies. Flavor & Nutrition
saw sales increase by +12 % to €852
million (or +6% in local currencies).
Robertet
Full Year 2012 Sales
- 20 February 2013 - Robertet has reported
sales for 2012 of 395.601 million euros, an increase of 6% over 2011.
Fragrance sales increased 3.57% to 141.052 million euros. Flavour
sales increased 8.85% to 154.89 million euros and Ingredient sales
increased 4.97% to 96.648 million euros.
Mane
- 2012 Sales increase of 20% - February 15,
2015 - Mane achieved a consolidated turnover
of € 638.4 million
in 2012, up 20.4% from €
530.1 million in 2011 (personal
communication). Mane's 5 Year average annual sales growth has been
above 15% - significantly higher than any other major F&F
company.
Takasago
9 Month 2012-2013 Sales
- February 14, 2013 - 9 Month sales increased
3% to ¥ 90,470 million from the prior fiscal year while net
income increased 57% to ¥ 4,053 million.
IFF
Full Year 2012 Sales
- New
York, Feb. 8, 2013 - revenue for the full year increased 1.1% to
$2,821.4 million. Local currency sales increased 4% for the full
year, reflecting accelerated momentum throughout the year. On a
like-for-like basis, sales increased 5%. The emerging markets
accounted for 47% of full year sales. Net income for the full year
totaled $254.1 million, compared with net income of $266.9 million in
the prior year. The Fragrance business unit revenue for the full year
of $1,443.1 million was flat compared with the prior year. Fragrance
local currency sales increased 3%. Flavors business unit revenue for
the full year increased 2.3% to $1,378.4 million. For the 4th Qtr,
total revenue increases 5.6% to $680.6 million. 4th Qtr Fragrance
revenue increase 10.1% to $354.1 million and 4th Qtr Flavors revenue
increased 1.1% to $326.4 million.
Sensient
F&F Full Year 2012 Sales
- Milwaukee, Feb. 8, 2013 - The Flavors &
Fragrances Group reported record revenue of $875.3 million in 2012
(including dehydrated products), up 2.1% from $857.5 million in 2011.
Operating income was $123.0 million in 2012 compared to $129.4
million in 2011. Foreign currency translation reduced revenue by
approximately three percent and operating income by one percent in
2012. In the 4th Qtr, the Flavors & Fragrances Group reported
revenue of $216.9 million, an increase of 5.6% over the $205.4
million reported in last year’s fourth quarter. Operating income
was $28.7 million in the quarter compared to $31.8 million in the
fourth quarter of 2011.
Givaudan
Full Year 2012 Sales
- Geneva, 5 February 2013 - For the full year,
Givaudan Group sales totalled CHF 4,257 million, an increase of 6.6%
in local currencies and 8.7% in Swiss francs compared to 2011. Sales
of the Fragrance Division were CHF 2,021 million, an increase of 8.4%
in local currencies and 10.3% in Swiss francs. Sales of the Flavour
Division were CHF 2,236 million, an increase of 5.0% in local
currencies and 7.4% in Swiss francs compared to 2011. Net income
increased to CHF 411 million in 2012 from CHF 252 million in 2011,
driven by an improved operating performance, lower financial expenses
and a lower income tax rate. This represents 9.7% of sales in 2012,
versus 6.4% in 2011. Basic earnings per share increased to CHF 45.15
in 2012 from CHF 27.71 in the previous year.
T.
Hasegawa 2011-2012 Sales Results - for the
full year ending September 30, 2012 consolidated net sales were
¥44,386 million compared to ¥ 44,246 in the prior year. Net
income for the period decreased 17% to ¥2,586
million.
----------------------------------------------------------------------------------------------------
In 2011, based on comparison of major currency
rates (on Dec. 31), the U$ $ had a increase of 0.48% against the
Swiss Franc, a decrease of 5.18% against the Japanese Yen, a decrease
of 4.72% against the Chinese Yuan and a increase of 15.76% against
the Indian Rupee. The dollar gained 3.3% against the Euro and 0.55%
vs the British pound. However, comparing single points in time can be
somewhat misleading as during the year major currency swings
occurred, particulary in the EU countries due to the continuing
economic instability. For a few major companies (e.g, Mane, IFF,
Sensient, Frutarom) 2011 was remarkably successful with some of the
largest year-to-year gains in recent years. Overall we estimate that
the total market was essentially flat with a marginal decline in US $
from 2010.
Takasago
Full Year 2011-2012 Sales
- May 14, 2012 - Takasago sales for the Fiscal
Year Ended March 31,2012 were ¥113,676 million compared to
¥114,861 million in the prior fiscal year (-1.0%).
Symrise
Full Year 2011 Sales - Holzminden, Germany
- March 14, 2012 - In 2011 Symrise reported sales of €1,583.6
million (+0.7%) or +2 % in local currencies. Scent & Care
reported sales of €801.4 million (-0.4%) or +1.0% in local
currencies. Flavor & Nutrition saw sales increase by +1.9 % to €782.2
million (or +3.1% in local currencies).
Frutarom
Full Year 2011 Sales
- Haifa, Israel – March 14, 2012 -
Frutarom's revenues in FY 2012 totaled US$ 518.4 million, a 14.9%
increase in comparison to revenues of US$ 451.1 million in 2010.
Mane
- 2011 Sales increase of 14.8% - February 16,
2012 - Mane achieved a consolidated turnover of USD 738 million in
2011, up 14.8% from USD 643 million in 2010 (personal
communication).
Givaudan
Full Year 2011 Sales
- Geneva, 16 February 2012 – In 2011,
Givaudan Group sales totalled CHF 3,915 million, an increase of 5.2%
in local currencies and a decline of 7.6% in Swiss francs compared to
2010. Sales of the Fragrance Division were CHF 1,833 million, an
increase of 4.7% in local currencies and a decline of 7.8% in Swiss
francs. Sales of the Flavour Division were CHF 2,082 million, an
increase of 5.7% in local currencies and a decline of 7.5% in Swiss
francs compared to 2010.
IFF
4th Qtr & Full Year 2011 Sales
- Feb. 9,
2012 - IFF full year 2011 sales were $2,788.0 million, a 6.3%
increase over 2010. 4th Qtr. sales were $644,383 million (+2.3%). Net
income for the full year increased 1.3% to $266.9 million. Operating
profit decreased $25 million year-over-year to $28 million including
an expense of $35 million associated with the patent litigation
settlement and restructuring costs in the fourth quarter 2011.
Excluding these items, operating profit increased 18 percent, or $10
million, to $63 million. Fragrance sales for the full year were
$1,440.7 million (+1.5%) while 4th Qtr sales were $321.6 million
(-3.0%). Flavor sales for the full year were $1,347.3 million (+12%)
while 4th Qtr sales were $322.7 million (+8.2%).
Sensient
F&F 2011 Sales
-
Milwaukee, Jan 7, 2012 - Revenue for the
Flavors & Fragrances Group increased 6.4% to a record $860.7
million in 2011, compared to $809.1 million reported in 2010.
Operating income for the year was $130.8 million, an increase of 7.3%
over the $122.0 million reported last year. Foreign currency
translation increased revenue and operating income by approximately
2% in 2011. The Flavors & Fragrances Group reported fourth
quarter revenue of $206.3 million compared to the $206.1 million in
the same quarter last year. Operating income for the quarter was
$32.2 million, a 9.3% increase over the $29.4 million reported in the
comparable period of 2010. However, as these figures include
dehydrated products such as dehydrated vegetables that are about 28%
of sales, we estimate that the sales of conventional flavors &
fragrances in 2011 were about $619.7 million.
Robertet
Full Year 2011 Sales
- 20 January 2012 - Robertet has reported
sales for 2011 of 373.282 million euros, an increase of 3.05% over
2010. Fragrance sales increased 4.26% to 136.194 million euros.
Flavour sales declined 0.87% to 142.291 million euros and Ingredient
sales increased 7.27% to 92.075 million euros.
T.
Hasegawa 2010-2011 Sales Results - for the
full year ending September 30, 2011 consolidated net sales were
¥44,246 million (-2.0% from 2010). Net income increased 9.7% to
¥3,115 million
----------------------------------------------------------------------------------------------------
In 2010, based on comparison of major currency
rates (on Dec. 31), the U$ $ had a decline of 10.8% against the Swiss
Franc, a decrease of 14.8% against the Japanese Yen, a decrease of
3.6% against the Chinese Yuan and a decrease of 3.8% angainst the
Indian Rupee. Conversely the dollar gained 6.8% against the Euro and
3.5% vs the British pound. However, comparing single points in time
can be somewhat misleading as during the year major currency swings
occurred, particulary in the EU countries due to economic
instability. For most major companies, 2010 was remarkably successful
with some of the largest year-to-year gains in recent years. We
estimate that the total market grew ~9-10% in US $ from 2009. This
growth was mainly fueled by emerging markets such as China, India and
Brazil. For the numerous small flavor & fragrance companies in
2010, which continue to lose market share, we estimate an overall
sales decline in US $ of about 2%.
Firmenich
2010-2011 Sales
- Oct. 12, 2011 - For the financial year ended
June 30, 2011, Firmenich posted sales of CHF 2,781.6 million, a
decline of 3.9% in Swiss Francs but an increase of 5.8% in local
currencies. Perfumery posted robust single-digit sales increases in
local currencies. Flavor sales posted high single-digit local
currency growth with increases across all segments. Ingredients sales
posted a healthy single-digit sales increase in local
currencies.
Frutarom
Full Year 2010 Sales
- Haifa, Israel – March 24, 2011 -
Frutarom's revenues in FY 2010 totaled US$ 451.1 million, an 8%
increase in comparison to revenues of US$ 425.2 million in 2009 in
local currency terms. The strengthening of the US dollar against
European currencies offset 1.9% of the increase in Frutarom's sales.
In terms of US dollars, the sales increased by 6.1% compared to
2009.
Symrise
Full Year 2010 Sales
- Holzminden, March 9, 2011 - Symrise
increased sales in 2010 by 15.4 % to € 1.571.9 million (+11% in
local currency) and exceeded its target to achieve sales growth of at
least 8 %. Scent & Care sales increased 17.9% to € 804.5
million while Flavor & Nutrition sales increased 12.9% to €
804.5 million.
Mane
- 2010 Sales increase of 27.6% - February 15,
2011 - Mane achieved a consolidated turnover of 480.1 million euros
in 2010, up 26.7% from 376.2 million euros in 2009 (personal
communication).
IFF
4th Qtr & Full Year 2010 Sales
- Feb. 10,
2011 - IFF full year 2010 sales were $2,622.9 million, an increase of
~13% in reported sales as well as local currencies. For the 4th Qtr
2010, sales were $629.9 million, an increase of 7.6%. Fragrance sales
for the full year were $1,419.6 million (+14.0%) while 4th Qtr sales
were $331.6 million (+5.1%). Flavor sales for the full year were
$1,203.3 million (+11.3%) while 4th Qtr sales were $298.2 million
(+10.4%). Net income for the full year increased 34.8% to $263.6
million.
Givaudan
Full Year 2010 Sales
- Geneva, 8 February 2011 – In 2010,
Givaudan Group sales totalled CHF 4,239 million, an increase of 8.9%
in local currencies and 7.1% in Swiss francs compared to the previous
year. Sales of the Fragrance Division were CHF 1,988 million, an
increase of 10.5% in local currencies and 9.0% in Swiss francs. Sales
of the Flavour Division were CHF 2,251 million, an increase of 7.5%
in local currencies and 5.4% in Swiss francs compared to the previous
year.
Sensient
F&F 2010 Sales
-
Milwaukee, Feb 04, 2011
- The Flavors & Fragrances Group reported full
year 2010 sales of $809.1 million, an increase of 4.7% vs. 2009.
Operating income for the same period declined 2.0%. For the 4th Qtr,
F&F sales were $206.1 million, up 5.2% while operating income
declined 0.5%. As these figures include dehydrated products such as
dehydrated vegetables that are about 28% of sales, we estimate that
the sales of conventional flavors & fragrances in 2010 were about
$582.6 million.
Robertet
Full Year 2010 Sales
- 17 January 2011 - Robertet has reported
sales for 2010 of 362.25 million euros, an increase of 18.7% over
2009. Fragrance sales increased 15.7% to 130.6 million euros. Flavour
sales increased 17.3% to 143.5 million euros and Ingredient sales
increased 26.1% to 85.8 million euros.
T.
Hasegawa 2009-2010 Sales Results -
December 13, 2010 - for the full year ending September 30, 2010
consolidated net sales were ¥ 45,167 million, up 4.4%. For the
same period, net income increased 58.5% to ¥ 2,840
million.
Takasago
Half Year 2010-2011 Sales
- November 22, 2010 - Sales for the half
fiscal year ending September 30, 2010 were ¥ 60,547 million, up
2.9% from the prior year while net income increased 85.1% to ¥
3,325 million.
Frutarom
3d Qtr 2010 Sales
- Haifa, Israel – November 16, 2010 -
Frutarom's revenues in the first 9 months of the year totaled US$
338.7 M, an increase of ~ 8.2% in local currency terms compared to
the first nine months of 2009 which totaled US$ 316.7. In US$ terms,
Frutarom's sales increased by ~ 6.9% compared to the first nine
months of 2009. Frutarom's revenues in 3d Qtr 2010 totaled US$ 111.0
M, an increase of 4.8% vs 2009. The weakening of the Euro and the
Pound Sterling against the US$, which was slightly offset by the
strengthening of the Swiss Franc and the NIS against the US$,
resulted in a 0.6% decrease in sales in US$ terms compared to 3d Qtr
2009.
----------------------------------------------------------------------------------------------------
Firmenich
2009-2010 Sales
- Oct. 13, 2010 - For the financial year ended
June 30, 2010, Firmenich posted record sales of CHF 2873 million, an
increase of 12.1% in local currencies and 8.7% in Swiss Francs,
regaining its position as growth leader in the fragrance and flavor
industry. This performance was driven by double-digit growth in
Perfumery and Flavor segments, with a particularly strong rebound in
Fine Fragrance during the second half of the year. The perfume and
flavor ingredients business followed the trend, recording a healthy
high single-digit growth performance.
Leffingwell estimates that Firmenich
increased market share by about 1.7% in the period.
Takasago
Full Year 2009-2010 Sales
- May 14, 2010 - Sales for the full fiscal
year ending March 31, 2010 were ¥114,347 million, down 7.8% from
the prior year.
Frutarom
4th Qtr & Full Year 2009 Sales
- Haifa, Israel – March 16, 2010 -
Frutarom's full year sales fell 10.2% (in US $) vs. 2008, totaling
$425.2 million. 4th Qtr sales increased 9.9% to $108.5
million.
Symrise
Full Year 2009 Sales
- Holzminden, March 3, 2010 - The company
increased sales by 3.2 % at actual rates and by 2.7 % at local
currency. The Flavor & Nutrition division increased revenues from
€ 648.1 million to € 679.7 million in the 2009. The Scent
& Care division benefited from an increase in business during the
second half of the year. Sales for the division rose by 1.6 % to €
682.3 million (previous year: € 671.8 million).
Givaudan
4th Qtr & Full Year 2009 Sales
- Geneva -
Feb. 16, 2010 - In 2009, Givaudan group sales totaled CHF 3,959
million, an increase of 1.4% in local currencies and a decrease of
3.1% in Swiss francs compared to 2008. On a comparable basis (in
local currencies and excluding the impact of divestments), sales
increased by 1.6% versus 2008. The Fragrance Division recorded full
year sales of CHF 1,824 million, an increase of 0.9% in local
currencies and a decrease of 3.9% in Swiss Francs. After a
challenging first quarter, business momentum recovered, improving
consistently during the three consecutive quarters. The Division
achieved sales growth of 5.3% in local currencies during the 4th Qtr
2009. The Flavour Division reported full year sales of CHF 2,135
million, representing a growth of 1.9 % in local currencies and a
decline of 2.5 % in Swiss francs. Excluding the effects of the
divested business, sales performance in local currencies increased
2.2%. During the fourth quarter of this year, the Division achieved
sales growth of 4.3% in local currencies.
Robertet
2009 Sales
- Feb. 15,
2010 - Robertet has announced that its 2009 turnover increased by
0.6% to 305.1 million euro. The company's flavor division (accounting
for about 40% of the company's total turnover), reported a 5.3%
growth to 122.3 million euro.
Takasago
3 Qtrs 2009-2010 Sales Results - Feb. 12,
2010 - For the 3 Qtrs period, April 1, 2009 - December 31, 2009,
sales declined 9.5% to ¥ 87,576,000. The company projects a
Consolidated Financial Sales Forecast for the fiscal year (April 1,
2009 - March 31, 2010) of ¥ 117,000,000, a decline year over
year of 5.6%.
Mane
2009 Sales increase 13% - February 08, 2010 -
Mane achieved a turnover of 376.2 million euros in 2009, up 13.1%
from 332.5 million euros in 2008 (personal communication).
Sensient
F&F 4th Qtr & Full Year 2009 Sales
- February 05, 2010 - The Flavors &
Fragrances Group of Sensient reported revenue for the 4th Qtr. of
$195.96 million, an increase of 2.3% compared to to the same period
in 2008. For the full year, sales declined 3.5% to $772.87 million vs
the same 2008 period. As these figures include dehydrated products
such as dehydrated vegetables that are about 29% of sales, we
estimate that the sales of conventional flavors & fragrances in
2009 were about $548.7 million.
T.
Hasegawa 2008-2009 Sales Results -
November 13, 2009 - for the full year ending September 30, 2009
consolidated net sales were ¥ 43,244,000, down 4.8%. For the
same period, earnings declined 19.9% to ¥ 1,792,000. For the
fiscal year ending September 30, 2010 the company projects that
consolidated net sales will increase 2.3% to ¥ 44,260,000.
In our table, these are listed as "2009" sales.
----------------------------------------------------------------------------------------------------
Firmenich
2008-2009 Sales
- Oct. 7, 2009 - For the financial year ended
June 30, 2009, Firmenich posted sales of CHF 2,641 million, a decline
of 4.3% in local currencies. Consumer products linked to basic needs,
like eating, drinking, washing and cleaning, were the most resistant
to economic crisis, while discretionary Fine
Fragrance suffered most. (It should be noted , in contrast to most
other companies who reported full year sales as of December 31,
Firmenich reported sales were from July 1, 2008 to June 30, 2009 -
the period of the world's worst economic and financial crisis).
In our table, these are listed as "2008" sales.
Takasago
2008-2009 Sales
- May 14, 2009 - Sales for the full fiscal
year ending March 31 were ¥123,973 million, down 0.2% from the
prior year - but beating the latest projection of ¥122,000
million issued in February. Flavor sales for the year increased 2.5%
while fragrance sales declined 3.4%. Aroma chemical & Fine
chemicals (combined) declined 4%.
Frutarom
Full Year 2008 Sales
- Haifa, Israel – March 19, 2008 -
Frutarom reported record sales of US$ 473.3 M for the year 2008 - a
growth of 25% compared with 2007, excluding the effect of the
strengthening of European currencies and the Shekel against the US
dollar. Without excluding the aforementioned effect, sales increased
by 28.5%. At the same time, Frutarom achieved an increase of 34.8% in
the annual gross profit to US$ 176.3 M, an improvement of gross
margin to 37.2% compared to 35.5% last year, a leap of 64% in
operating profit which totaled US$ 56.6 M. During the 4th Qtr of
2008, Frutarom's sales totaled US$ 98.7 M, a decrease of 1% compared
to the same quarter last year, excluding the effect of the weakening
of the European currencies and the Shekel (in which most of
Frutarom's sales are made) against the US dollar, at rates of up to
24%. Without excluding the aforementioned effect, sales decreased by
9%. The considerable trend of reducing inventory levels among
Frutarom's customers worldwide in the last few months, also affected
the decrease in sales during the fourth quarter.
Symrise
Full Year 2008 Sales Results
- Holzminden, March 4, 2009 - Overall sales
for 2008 increased to EUR 1,319.9 million (+6.5% in local currencies
and +3.6% in euros). Scent & Care increased to EUR 671.8 million
(+3% in local currencies and +0.1% in euros). Flavor & Nutrition
increased to EUR 648.1 million (+10.5% in local currencies and +7.4%
in euros). For the year, net income dipped -7% in euros and - 2% in
local currencies to € 90.4 million. "The sales performance of
Scent & Care in fiscal 2008 was mixed. While Life Essentials,
Household, Aroma Molecules and Mint performed according to plan, the
“luxury segments” Fine Fragrances and Personal Care had to
contend with demand problems caused by the global economic situation.
In 2008, Scent & Care generated sales of € 671.8 million. As
a result, including the acquisitions Intercontinental Fragrances and
Manheimer Fragrances, sales reached the previous year’s mark. At
local exchange rates Scent & Care’s sales were up by 3%.
Excluding Intercontinental Fragrances and Manheimer Fragrances, sales
fell slightly by 0.7% to € 666.8 million (+ 2.2% on a local
currency basis). Including Chr. Hansen Flavors, Flavor &
Nutrition recorded sales of € 648.1 million in 2008, an increase
of 7.4% (10.4% at local rates). Excluding Chr. Hansen Flavors, sales
rose by 2.4% to € 617.5 million (5.0% on a local currency
basis). After the acquisition in April, Chr. Hansen flavors posted
sales of € 30.6 million."
Givaudan
Full Year 2008 Sales Results - Geneva, 17
February 2009. In 2008, Givaudan group sales totalled CHF 4,087
million, an increase of 6.7% in local currencies and a decrease of
1.1% in Swiss francs compared to 2007. On a pro forma basis,
excluding the impact of the ongoing portfolio streamlining, sales
increased by 2.5% in local currencies. Including this effect, sales
on pro forma basis increased by 1.0% in local currencies and
decreased by 6.4% in Swiss francs. Fragrance Division sales were CHF
1,898 million, an increase of 7.9% in local currencies and a decrease
of 0.1% in Swiss francs versus 2007. On a pro forma basis, and,
excluding the impact of discontinued ingredients, sales grew by 1.7%
in local currencies. Sales of the Flavour Division were CHF 2,189
million, an increase of 5.8% in local currencies and a decrease of
2.0% in Swiss francs compared to the previous year. On a pro forma
basis, and, excluding the streamlining of commodity ingredients and
the St. Louis divestment, sales increased by 3.1% in local
currencies.
IFF
Full Year 2008 Sales Results
- Feb. 5, 2009 - Full year 2008 reported sales
totaled $2,389 million, up 5% from 2007; Flavor and Fragrance sales
increased 9% and 2%, respectively. 2008 sales benefited from the
weaker U.S. dollar for most of the year. At comparable exchange
rates, sales would have increased 2% over the prior year. Net Income
was $230 million versus $247 million in 2007. The change is mainly
attributable to $32 million of higher interest expense in 2008,
partially offset by higher volume and favorable currency impacts. 4th
Qtr. Sales in local currency increased 2% versus the comparable
period in 2007, whereas reported sales of $539 million were down 3%
due to the strengthening U.S. dollar. 4th Qtr. flavor sales were up
3% in local currencies while reported sales worldwide declined 1%,
reflecting the stronger U.S. dollar. Fragrance sales in local
currency were flat versus the comparable period last year, while
reported sales were down 4%.
Sensient
F&F Full year 2008 Sales Results
- Feb. 5, 2008 -Sensient Flavors &
Fragrances reported record revenue and operating income in 2008.
Annual revenue for the Group increased 5.4% to $809.6 million,
compared to $768.1 million in 2007. As these figures include
dehydrated products such as dehydrated vegetables that are about 27%
of sales, we estimate that the sales of conventional flavors &
fragrances in 2008 were about $591 million. Operating income in 2008
was up 7.6% to $123.5 million, compared to $114.7 million in 2007.
For the 4th Qtr. F&F revenue was $193.5 million, off 1.2%
compared to 4th quarter 2007 revenue of $195.8 million. Quarterly
operating profit of $29.2 million was down 1.8% compared to prior
year fourth quarter operating income of $29.7 million. Quarterly
revenue and operating income on a local currency basis increased 5.8%
and 5.4%, respectively. The stronger US dollar currency translation
reduced reported revenue and operating income for the Flavors &
Fragrances Group by approximately 7% in the 4th quarter.
Robertet
Sales for 2008 - Jan 20, 2009 - For the
full year 2008, sales increased 25.7% to 303.17 Million Euros,
reflecting the full year integration of the Charabot
sales.
Mane 2008 Sales - Sales
for the full year 2008 rose to 332.5 million Euros, an increase of
8.2% year over year (personal communication).
Takasago
Year 2008/9 Sales Projections
- Feb. 12, 2009 -
Takasago has reduced its sales projections for the full fiscal year
2008/2009 ending Mach 31 to ¥122,000 million.
T.
Hasegawa 2008 Sales Results - for the full
year ending September 30, 2008 consolidated net sales were ¥
45,421,000, down 9.3%. For the same period, net profit declined 46%
to ¥ 2,238,000.
Takasago
Year 2008/9 Sales Projections
- Feb. 12, 2009 -
Takasago has reduced its sales projections for the full fiscal year
2008/2009 ending March 31 to ¥122,000 million.
Firmenich
2007-2008 Sales
- Oct. 9, 2008 - Firmenich posted strong sales
growth for its fiscal year ended June 30, 2008, despite an economic
downturn during the second half of the year. Sales increased 18.4% in
local currencies, 13.5% in Swiss Francs, to reach an annual turnover
of CHF 2,847 million. In our table, these are listed as
"2007" sales.
Rank is based on US$
equivalents
(1) Estimated 1999 Total World
Flavor & Fragrance Sales of US $12.9 Billion. Again in year
2000, we estimate that sales growth in local currencies was about
3-4%, but the continued strengthening of the U.S. dollar against
major currencies once again leaves the estimated total market in U.S.
dollars at about U.S 12.9 Billion. For 2001 we believe that growth in
local currencies was about 2% or less and that in US $ equivalents
the market shrank to about U.S $12.7 Billion based on the strength of
the dollar. For 2002, we estimate that the total world market is
$15.1 billion. This sizable increase reflects a decrease in the value
of the U.S. dollar of about 17.8% vs. major currencies at 12/31/02 vs
12/31/01. The continued weakness of the U.S. dollar in 2003 against
the worlds major currencies (a decline of about 16%) again has
affected the size of the total market in U.S. dollars (the 2003
estimate being about U.S. $16.3 billion). For 2004, the U.S. $ was
again down about 5-6% against major currencies. We estimate that
growth in local currencies was about 3% resulting in a total market
size of about U.S. $17.7 billion. For 2005, the U.S. $ strengthened
by about 12% against major currencies. We estimate that growth in
local currencies was about 3% in 2005 resulting in a total market
size of about U.S. $16.0 billion. For 2006, the US $ declined in
value against the world's major currencies by about 9%. We estimate
that growth in local currencies was about 3-4% resulting in a total
market size of about U.S. $18 billion. For 2007,
the US $ again declined in value against the world's major currencies
by about 5.8%. For 2007, we estimate that growth in local currencies
was about 4.5% resulting in a total market size of about
U.S. $19.8 billion.
In 2008, based on comparison of major currency rates (on
Dec.31), the U$ $ had a decline of 6% against the Swiss Franc, a 23%
decline against the Japanese Yen and about a 5% gain aganst the Euro.
However, comparing single points in time can be somewhat misleading
as during the period of March to August 2008, the dollar had a
decline of about 26% against the Euro in the same prior year period.
In addition, the deteriorating worldwide economic situation during
the last 1/3 of the year negatively impacted sales volumes. At best
we estimate that the total market grew in 2008 at about 2.5-3.0% in
US $.
It should be noted that Givaudan in 2001
estimated the total F&F market at "roughly" 15 billion CHF (U.S.
$ 8.7 billion) while in a market study (April , 2001)
ChemSynergy
estimates the market for flavor and fragrance products is at present
globally in the order of $12.24 billion. Also in a market study by
The
Freedonia Group, they estimated the
world F&F market as $14.15 billion in 1999 with a projected
growth to $18.4 billion by 2004. Get
a copy of the Freedonia Press Release.
For a historical review of Total Market Size,
see below.
Lazlo Unger, an economist at Givaudan ,
estimated the world F&F market at US 4.0 billion in 1979, 4.2
billion in 1981 (Source: Perfumer & Flavorist, Vol. 7,
August/September, 1982, p. 52) and 7.0 billion in 1987 (Source:
Perfumer & Flavorist, Vol .14, May/June, 1989, p. 43). Hans
Hartmann of H&R estimated the world F&F market at US $ 7.8
billion in 1990 and 9.6 billion in 1995 (Source: Perfumer &
Flavorist, Vol .21, March/April, 1996, p. 22), and the flavor market
(only) at 4.5 billion in 1994 (Source: Perfumer & Flavorist, Vol
. 20, September/October, 1995, p. 35). Ron Fenn of IFF estimated the
total F&F market in 1995 at about US $ 10 billion and
projected a market of 12 billion in the year 2000 (Source: Perfumer
& Flavorist, Vol .23, March/April, 1996, p. 11 ) in concurrence
with (or based on) Hartmann's estimates.
For information, Chemical & Engineering
News (for 2002) and Unger (for 1987) estimated world F&F sales by
category as follows:
|
Category
|
% of Sales
1987
|
% of Sales
2002
|
|
Fragrance compounds
|
33.6%
|
35%
|
|
Flavor compounds
|
32.8%
|
41%
|
|
Aroma Chemicals
|
17.9%
|
12%
|
|
Essential Oils & Other Natural
Products
|
15.7%
|
12%
|
Takasago
2006-2007 Record Sales - May 15, 2007 -
Sales for the fiscal year ending March 31st were ¥113,876
million, up 7.7% from the prior year. Net income increased 68% to
¥ 4,885 million.
Givaudan
2006 Sales - February 20, 2007 - Geneva,
Switzerland, 20 February 2007. In 2006, Givaudan’s total sales
increased to CHF 2,909 million, representing a 4.7% rise in Swiss
Francs and a 3.5% rise in local currencies. Despite the continued
ingredients streamlining in both divisions, the company continued to
deliver above market sales growth for the sixth consecutive year.
This streamlining impacted annual sales by CHF 33 million. Without
this effect, sales in local currencies would have increased by
4.9%
Takasago
3d Qtr 2006 Results - Feb. 13, 2007 -
Gross Sales for the period April 1- December 31, 2006 increased 6.7%
to ¥84,136,000. Operating profit for the same period increased
10% to ¥5,274,000.
Robertet
2006 Sales - reported 2006 sales were
221,127 million euros, an increase of 6.8% over 2005
sales.
Symrise
2006 Sales - Feb. 6, 2007 - Symrise has
reported preliminary sales results for 2006 of 1,230.0 million euros,
up 7% from 2005. Preliminary EBITDA for 2006 was reported as 243.0
million euros, up 25.8%.
Quest
4th Qtr & full year 2006 Sales
- Feb. 8, 2007 - Quest's 4th Qtr. sales
increased 2.9% to 143 £m while full year 2006 sales were up 5%
to 588 £m. 4th Qtr trading profit increased 36% to 15 £m
while full year 2006 trading profit was up 7% to 76
£m.
Sensient
F&F 4th Qtr & full year 2006 Sales
- Feb. 12, 2007 - Sensient's Flavors & Fragrances Group achieved
record results in 2006, as revenue for the twelve months increased
9.4% to $733.4 million and operating income increased 26.7% to $104.5
million. Flavors & Fragrances Group revenue grew 9.4% to $185.0
million in the quarter ended December 31, 2006, compared to $169.1
million in the prior year's fourth quarter. Quarterly operating
income jumped 42.8% to $27.0 million compared to $18.9 million in the
fourth quarter of 2005. As approximately 23% of F&F sales
historically has been in dehydrated vegetables, we estimate that
Sensient's true F&F sales were about $565 million for year
2006.
IFF
4th Qtr & Full Year 2006 Results
- New York, N.Y., January 30, 2007
… Fourth
quarter 2006 sales totaled $514 million, up 11% from the prior year
quarter; fragrance and flavor sales increased 13% and 7%,
respectively. Sales for the 4th quarter benefited from the generally
weaker U.S. dollar; at comparable exchange rates, sales would have
increased 7% in comparison to the 2005 quarter. Net income for the
2006 fourth quarter, including $1 million in after tax restructuring
charges, totaled $44 million, a 192% increase compared with the prior
year quarter. The 2005 fourth quarter result of $15 million included
restructuring charges of $16 million after tax. Excluding the
restructuring charges from both years, net income increased 48% in
the 2006 fourth quarter. Sales for the full year 2006 increased 5
percent to $2.10 billion from $1.99 billion in the prior year. For
year 2006, fragrance sales increased 5% and flavors increased 4%. Net
income for 2006, including $2 million in after tax restructuring
charges, totaled $223 million, a 15% increase compared with the prior
year. Full year 2005 results of $193 million included restructuring
charges totaling $16 million after tax, as well as a tax benefit of
$25 million relating to repatriation of funds from overseas
affiliates. Excluding the restructuring charges from both years and
the one-time tax benefit from 2005, net income in 2006 increased 22%
versus the comparable 2005 result.
T.
Hasegawa 2006 Sales Results - for the full
year ending September 30, 2006 consolidated net sales were
¥47,000,000, down 1.6% while consolidated net income declined
4.35% to ¥ 3,713,000.
|
Disclaimer: The figures reported are
derived from reliable published sources and represent our
best estimates. We disclaim any material interest in any of
the companies for which information is provided. Statements
presented here which are not historical facts or information
must be considered "forward-looking statements" within the
meaning of the Private Securities Litigation Reform Act of
1995, and are subject to risks and uncertainties that could
cause a company's actual results to differ materially from
those expressed or implied by such forward-looking
statements. Risks and uncertainties with respect to a
company's business include general economic and business
conditions, the price and availability of raw materials, and
political and economic uncertainties, including the
fluctuation or devaluation of currencies in countries in
which a company does business. Investors should not accept
any information presented here as fact without independent
verification. If errors are found in our market analysis, we
would gratefully accept factual corrections.
This information is provided gratis as a
service to those in the Flavor & Fragrance
industry.
|
Comments on Total Market Size
(2006-2008)
Leffingwell & Associates includes
"ingredient" sales in their sales
estimations, some of which run through the sales of the major F&F
companies (e.g. especially Givaudan, Firmenich, Symrise, Takasago
& IFF). It should be obvious that other F&F suppliers such as
Kerry, AM Todd, Huabao International, Ogawa, Kao, BASF., Rhodia.
Citrus & Allied. Millennium Specialty Chemicals div. of Lyondell,
Bell Flavors & Fragrances, Cargill Flavor Systems, Camphor &
Allied Products, Etol d.d, Shiono Koryo Kaisha, Nagaoka Perfumery
(all with estimated sales in the range of about $50-250 million),
plus the other ~400 F&F companies, are important to the total
market size. One of the controversial problems in estimating total
market size has to do with potential (or real) double counting of
sales. This is a particular issue in the case of "ingredients".
For example - in the case of essential oils and aroma chemicals they
are often sold twice, e.g., the producer sells to a company which
then sells to another company. For essential oils, these often
require a distillation and standardization before the are ready for
the end user F&F company. Or in the case of aroma chemical
producers, they may sell to another company (in bulk) who then
repackages in smaller containers for further sale.
These multiple transactions are considered by
Leffingwell as being "value added" for the ultimate F&F customer
and are therefore included in our figures for total market size.
It should be noted in 2005 Freedonia projected that the
F&F market size would be about $18.6 billion by 2008
(http://www.freedoniagroup.com/brochure/18xx/1886smwe.pdf)
and that Business Insights estimated the F&F market to be
$18 billion in 2006 (http://www.globalbusinessinsights.com/content/rbig0001m.pdf).
Similarly, in 2005 Frost and Sullivan estimated that the top five
suppliers accounted for approximately 54 percent of the total
F&F revenues (which translates to a slightly higher estimate
for the total market size than the Leffingwell estimate). See
http://www.frost.com/prod/servlet/report-overview.pag?repid=B722-01-00-00-00&ctxst=FcmCtx1&ctxht=FcmCtx2&ctxhl=FcmCtx3&ctxixpLink=FcmCtx4&ctxixpLabel=FcmCtx5
However, we are aware that IAL Consultants (see below) estimates
the 2006 market size at about $12.6 billion and that Firmenich
estimated that for 2006-2007 that the total market size was closer to
US$15 billion. Similarly, Givaudan has estimated the total market
size at about CHF 17-18 billion (about US $16.9-17.9 billion) for
2008 ( see http://www.givaudan.com/staticweb/StaticFiles/GivaudanExtranet/Publications/fin_pubs/fy_report/2008/givaudan_2008_fy_an_fn.pdf
). Some of these discrepancies may arise from
the "double counting" of sales issue discussed above.
A recent report on the size of the Essential oil and Aroma
chemical market size is of interest.
BCC Research reports
on the 2006 market for Essential oils and Aroma
chemicals at http://www.bccresearch.com/report/CHM034B.html
BCC Research reports
"The worldwide flavors and fragrance
"ingredient" market is
estimated to be worth approximately $6.3 billion in
2006. Poised for an average annual growth rate
(AAGR) of 4.5% per year, this value should grow to $7.8 billion in
2011. Flavors and fragrances have similar economic and operational
characteristics, including research and development, the nature of
the creative and production processes, the manner in which the
products are distributed and the preferences of the customers. World
demand for quality essential oils and their derivatives is likely to
see increasing demand in the coming years, and natural products will
continue to remain an important part of the flavors and fragrances
industry. The market should reach $5.0 billion by 2011, an AAGR of
5.2%."
.............................................................
Estimated 2006 Worldwide Essential Oil
& Aroma Chemical Sales
...............................................................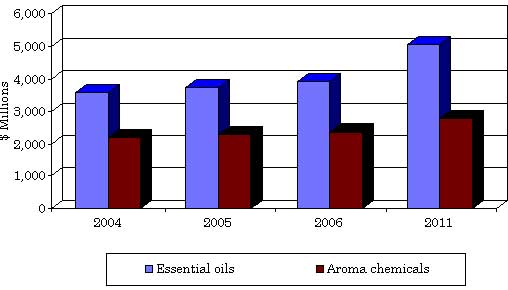
...............................................................Source;
BCC Research Report ID:CHM034B, Published: December 2006,
Analyst: N. S. Venkataraman
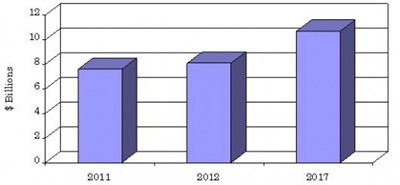
The flavor and fragrance industry's total demand
for ingredients was an estimated $7.6 billion in 2011 and growing at
a projected CAGR of 5.7%. At this rate, the market should reach $8.1
billion in 2012 and $10.7 billion by 2017 (Source: BCC Research at
http://www.bccresearch.com/report/flavors-fragrances-global-markets-chm034c.html)
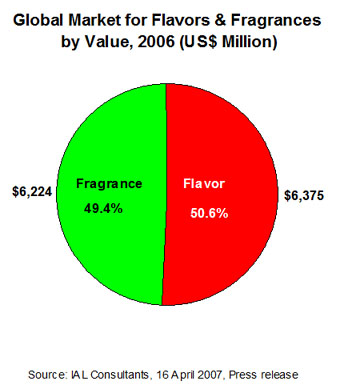
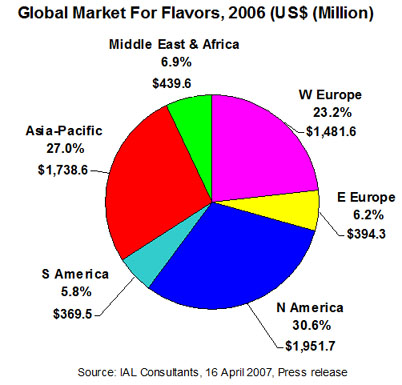
April 16, 2007 - A Press Release from IAL
Consultants estimated the World F&F market at $12.6 billion. As
their figures for the total market are close to that firmly
documented for the top ten companies, they must be excluding
much of the sales of the nearly 400+ other companies in the
F&F Industry. The following charts shows their estimates as
to the market breakdown. See http://www.ialconsultants.com/website/pdf/8289P.pdf
...... ..........
June 23, 2000 - A press release from
IAL Consultants estimated the World F&F market at $10.4
billion. The following charts shows the estimates as to the market
breakdown.
 Email: leffingwell@mindspring.com
Copyright © 2000-2013 by
Leffingwell &
Associates
General Notice: Leffingwell &
Associates strives to ensure that the information contained in this
Web site is accurate and reliable. However, Leffingwell &
Associates and the Web Master are not infallible, and errors may
sometimes occur. Therefore, Leffingwell & Associates disclaims
any warranty of any kind, whether express or implied, as to any
matter whatsoever relating to this Web site, including without
limitation the merchantability or fitness for any particular purpose.
Leffingwell & Associates will from time to time revise the
information, services and the resources contained in this Web site
and reserves the right to make such changes without any obligation to
notify past, current or prospective visitors. In no event shall
Leffingwell & Associates be liable for any direct, indirect,
special, incidental, or consequential damages arising out of any use
of the information contained herein.
|
Other Subjects on the
Leffingwell & Associates Site
|